Some people are confused by the media reports and alarmism about carbon dioxide, or CO2. They are left with the impression that CO2 is suffocating the earth and acting like a thick blanket warming the planet. So here’s some simple information about CO2 for those who want some basic facts. Please share it around.
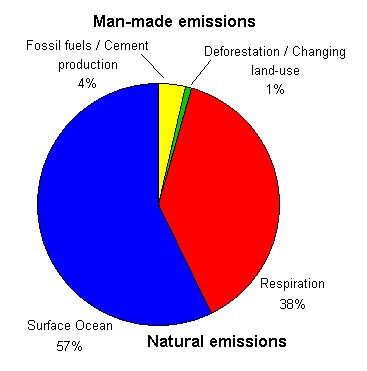
As we can see in the diagram below (taken from the ARIC Atmosphere, Climate & Environment Information Programme website a DEFRA endorsed teaching resource for Key Stage 4 and A-Level students in the UK) the sources of carbon dioxide show that 95% of CO2 occurs naturally. There is nothing we can do about it.
Only roughly 5% is produced as a result of man’s activity. We know that for every 1,000,000 (one million) parts of atmosphere, around 385 are CO2 and this figure has increased as a result of CO2 being released from the oceans as they get warmer. The rest is made up of other gases and vapours. So based on the diagram below, anthropogenic (man made) CO2 emissions add up to just 19 parts per million parts of atmosphere.
 Are we really to believe that the world faces catastrophe as a result of man being responsible for the existence of 0.0019% of a naturally occuring gas in the atmosphere, but that we can stave off disaster if we reduce that contribution to 0.0007%? Why are politicians not asking themselves questions like this before rushing to regulate and tax our behaviour? Could it be because this helps them to further another agenda?
Let’s look at the volume of CO2 in the atmosphere and man’s contribution in a graphical manner. Take the image below (it is quite a large file size). It consists of 1 million dots, each one representing a particle of atmosphere. Download it and increase its size until you can see the colouration in the top left corner. The green dots are naturally occuring CO2, the red dots (barely perceptible unless the image is fully enlarged) are human produced CO2 and the black dots are other gases and vapours.

Now think about the CO2 industry that has sprung up and all the billions of dollars, pounds, euros, etc that are being spent to reduce the volume of CO2 in the atmosphere by a trifling 10 or so parts per million. A mere ten or so dots in this image. Yet we are supposed to believe this will make a difference in global temperature of 2C or more, prevent drought, flooding, hurricanes, melting glaciers, receding rainforests and so on.
Is it any wonder so many people are not buying the global warming narrative any more? Following the last three bitterly cold winters is it any wonder trust in these people is evaporating as they – the warmists who predicted for years warmer and wetter winters were a sign of CO2 induced global warming – now say the opposite and claim that, actually, colder and more icy winters are evidence of warming?
By way of reinforcing the extent of anthropogenic emissions and putting this into context with the atmosphere, this short video is a valuable aid. I do not vote for the party that produced it, but the message is nonetheless important to understand (with thanks to ‘right writes’ in the comments).


What is also frightening is that there is an ARIC DEFRA endorsed teaching aid for schools. The trend to indoctrinate the young at school has been, in my opinion, one of the worst aspects of modern life.
Yes…
Further explanation in this video:
(Thanks for this, I have added the video to the post itself – AM)
Oh…
Have I mentioned that even GISS (the primary mover in the AGW theory) understands that increasing CO2 is used by an increasing number of plants, which greedily gobble up as much CO2 as they can get, and poo oxygen.
http://www.theregister.co.uk/2010/12/08/new_model_doubled_co2_sub_2_degrees_warming/
It would be interesting to plot the size of bureaucracies, over time, on various “issues”.
My hypothesis is that any bureaucracy has a very fast establishment rate. The number of bureaucrats increases from zero to some finite number over a short period of time to meet the perceived “urgency” of the “issue” to be addressed.
It then goes into a steady state when the number of bureaucrats is sufficient to absorb all of the available funding. Bureaucracies can remain in this state for years, or even decades, finely adjusting staff numbers to ensure that all of the available budget is consumed within each financial year. At this point, the “issue” becomes irrelevant.
At some later stage, the annual increase in funding falls to a level where the current number of bureaucrats can no longer be sustained at the current level of salaries, and at that point, that particular bureaucracy will commence a slow decline.
At some stage the bureaucracy may become absorbed into another emerging bureaucracy, or it may recognise a brand new “issue” that it can pin to its mast. Very rarely do they just “go away”.
Why is this important?
Well if we define wealth as being a measure of useful productive output in terms of goods and services, then the wealth created by a bureaucracy is always less than zero.
For sure, bureaucrats consume goods and services, which means that the economy must produce goods and services, which keeps the non-bureaucrats employed so they can pay taxes to fund the bureaucrats, as indeed the bureaucrats themselves do.
But all of this production of goods and services needs to be monitored, and standardised, and codified, and monitored again, and reported upon, to ensure that everything is according to plan.
So, it is a closed system with few, if any inputs. At the end of the day, the bureaucracy will consume itself.
In which case, it pays to be prepared: I am prepared to swap my fine pig for six sacks of your excellent flour …
AM, just came here via your own link from a recent post. (somebody asked re the million dot explanation) Have just read Rereke Whakaaro’s comment and it is one of the best comments I have read, ever in the thousands of comments and blogs I get through. Fucking A. And so frustrating!
Most of this video has been debunked since it was made. CO2 LAGS climate change, NOT leads it, Water vapour is the biggest green house gas by 80%, CO2 represents 0.0019% of the atmosphere. Humans contribute 2% of all CO2 and on it goes. This video is sheer proporganda and total missinformation rubbish and should be pulled from the site.
Y’all know this isn’t true, right? Because if it were, why would the CO2 be going up?
If this worked, you could get rich from having two bank accounts and doing a lot of transfers between them. You kind of aren’t accounting for the debits.